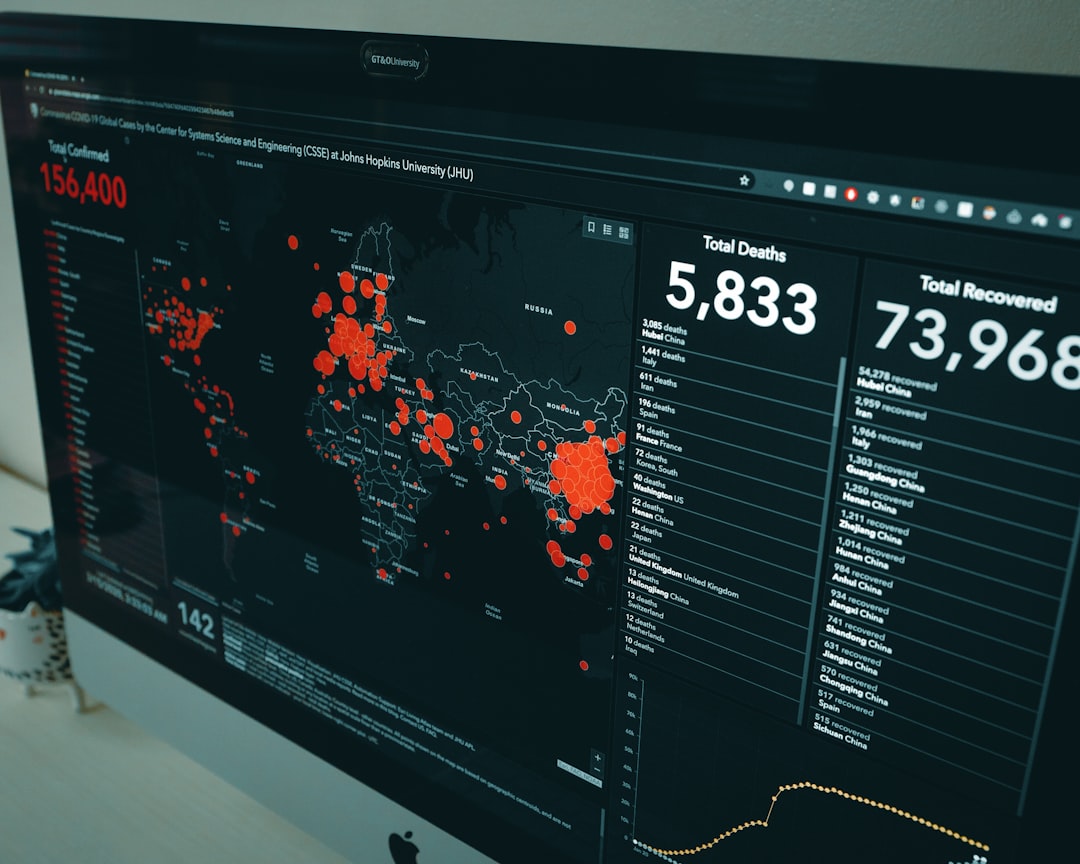
In today's data-driven world, businesses have access to vast amounts of information. However, making sense of this data and using it to make informed decisions can be a daunting task. This is where data analytics and visualization come into play. By leveraging these tools, businesses can gain valuable insights and transform raw data into actionable information that drives strategic decision-making. In this article, we will explore the basics of data analytics and visualization, the benefits they offer, and how they can help improve decision-making in various industries.
The Basics of Data Analytics and Visualization
Data analytics involves the process of examining raw data to uncover patterns, correlations, and trends. It uses various techniques and tools to extract meaning from the data and transform it into valuable insights. On the other hand, data visualization is the graphical representation of this analyzed data. By creating visual representations such as charts, graphs, and infographics, businesses can communicate complex information in a more intuitive and understandable manner.
The Benefits of Implementing Data Analytics and Visualization
Implementing data analytics and visualization can offer several benefits to businesses:
Improved Decision-Making: Data analytics and visualization provide businesses with a solid foundation for decision-making. By analyzing historical and real-time data, businesses can identify patterns and trends that help them understand their customers, optimize processes, and uncover new opportunities.
Enhanced Efficiency and Productivity: With data analytics and visualization, businesses can automate repetitive tasks and streamline processes. This allows employees to focus on high-value activities and make data-driven decisions quickly.
Identifying Customer Insights: By analyzing customer data, businesses can gain a deeper understanding of their target audience. This insight enables them to tailor their products, services, and marketing strategies to meet customer needs effectively.
Risk Mitigation: Data analytics can help identify potential risks and predict outcomes, allowing businesses to make informed decisions that minimize risks and maximize opportunities.
Competitive Advantage: Businesses that leverage data analytics and visualization gain a competitive edge by making proactive decisions based on accurate insights. This helps them stay ahead of the competition and adapt to changing market conditions.
The Importance of a Data-Driven Approach
A data-driven approach to decision-making is crucial in today's business landscape. It ensures that decisions are based on evidence and facts rather than intuition or guesswork. By utilizing data analytics and visualization, businesses can identify patterns, trends, and outliers, enabling them to make informed choices that align with their goals.
How Visualization Enhances Decision-Making
While data analytics provides valuable insights, the presentation of this information is equally important. Data visualization simplifies complex data sets, making it easier for decision-makers to understand and interpret the information. Visual representations highlight key trends, correlations, and outliers, enabling decision-makers to grasp the significance of the data at a glance. This visual understanding facilitates more effective communication, collaboration, and decision-making across all levels of the organization.
Real-World Examples
Several companies have successfully implemented data analytics and visualization strategies to achieve their business goals:
Netflix: The entertainment streaming giant uses data analytics to personalize recommendations for its users. By analyzing user behavior and viewing patterns, Netflix suggests relevant content, enhancing user satisfaction and retention.
Amazon: As one of the largest e-commerce platforms, Amazon utilizes data analytics to optimize its supply chain and forecast demand. This enables the company to streamline operations, reduce costs, and deliver products more efficiently.
Google: Google leverages data analytics and visualization to improve search engine algorithms and provide users with more relevant search results. By analyzing user search queries and click-through rates, Google continuously refines its algorithms to enhance the user experience.
Uber: Uber uses data analytics to optimize its pricing strategies, determine driver availability, and predict rider demand. By analyzing historical booking data, Uber can dynamically adjust pricing to match supply and demand, ensuring a smooth experience for both drivers and riders.
Conclusion
Data analytics and visualization have become invaluable tools for businesses seeking to make informed decisions. By leveraging these tools, businesses can transform raw data into actionable insights that drive strategic decision-making. From improving efficiency and productivity to identifying customer insights and mitigating risks, data analytics and visualization offer numerous benefits across various industries. Embracing a data-driven approach and utilizing visual representations of data can empower businesses to stay ahead of the competition, adapt to changing market conditions, and achieve their business goals.
Sources:
Tableau: Data Visualization
Harvard Business Review: The Competitive Advantage of Analytics
Forbes: How 800-CEO-Read Used Data Analytics To Create Their New System
